Who’s blowtorching American jobs?
Before delving into the latest abysmal jobs report, this video by John Titus of BestEvidence published back in February presents clear analysis of the Labor Force Participation Rate and what has really been happening with employment since the onset of the crisis in 2008.
Interestingly and ironiaclally it can be tracked along with Federal Reserve activity.
Payrolls Disaster: Only 142K Jobs Added In September With Zero Wage Growth; August Revised Much Lower
And so the “most important payrolls number” at least until the October FOMC meeting when the Fed will once again do nothing because suddenly the US is staring recession in the face, is in the history books, and as previewed earlier today, at 142K it was a total disaster, 60K below the consensus and below the lowest estimate.
Just as bad, the August print was also revised far lower from 173K to 136K. And while it is less followed, the household survey was an unmitigated disaster, with 236,000 jobs lost in September.
• source: zerohedge.com
Participation Rate Crashes To October 1977 Level: Americans Not In The Labor Force Soar By 579,000 To Record 94.6 Million
While the September jobs number was an absolute disaster, here is the real punchline: in September, the people not in the labor force soared by a whopping 579,000 to a record 94.6 million, up from the previous record 94.0, even as number of people employed – according to the household survey used to calculate the “5.1%” unemployment rate – tumbled by 236,000 to 148.8 million.
And as a result of this latest surge in people who aren’t working, nor want to work, the participation rate crashed yet again, and sliding from 62.6% to 62.4%, it was the lowest since October 1977.
• source: zerohedge.com
The Feudal “Recovery” Continues: 21,000 Waiters Added; 9,000 Manufacturing Workers Lost
In our final look at today’s lack of jobs report, we wanted to highlight two quick things.
First, of the 142K jobs added in September, 24K was government jobs, …..because more government hiring is what the U.S. needs.
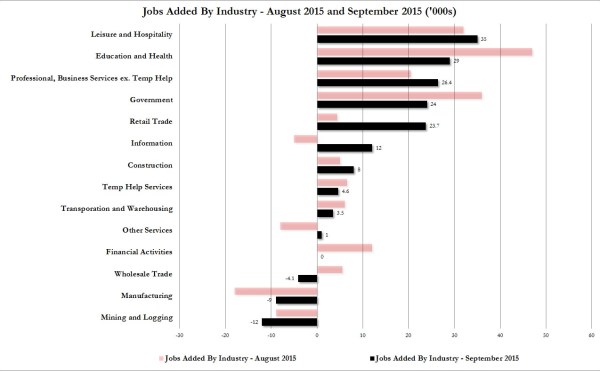
Sarcasm aside, this left just 118K for the private sector. Of this 118K, 78% went to low/minimum-wage paying jobs: Leisure and Hospitality was 30% of the total, adding 35K jobs, 25% was for education and health, more minimum wages, with Retail and Temp Help rounding out the remaining 23% in “gains.” Meanwhile jobs which actually pay good wages, mining and logging, manufacturing and wholesale trade, all declined in September.
Unfortunately, there are still those – mostly economists and drama majors – who are still clueless about why the US economy is stuck in centrally-planned quicksand or merely doing their best to boost the government propaganda, here is the chart.
And since there will still be confusion, here is data so simple, even a 5 year old will get it: in September, the US economy added 21,000 waiters and bartenders and lost another 9,000 manufacturing workers
Finally, since the start of the depression in December 2007, the US economy has added 1.5 million waiters and bartenders and lost 1.4 million manufacturing workers.
• source: zerohedge.com
The US Has Added Three Times More Foreign-Born Workers Than Native-Born Since December 2007
If you thought the headline jobs print was bad, wait till you see this.
While we will show the quality of the jobs shortly (you guessed it: waiters and bartenders jumped, manufacturing workers tumbled), with the presidential elections, in which immigration has become the key topic coming up, a far more relevant issue is the spread between “native-born” workers (as defined by the BLS), and “foreign-born.” Expect the September data to provide much fodder for the upcoming republican and democratic Republicrat debates.
But before we show what happened, here is a quick glance at the breakdown between full and part-time jobs in September. According to the BLS, 53,000 part-time jobs were added in September. The offset: a drop of 185,000 full-time jobs. Welcome, once again, to the part-time recovery we first profiled in December 2010.
While we “know” that a paltry 142K jobs were added according to the Establishment survey, a far more disturbing trend emerges when observing the Household survey, which conveniently breaks down the number of “native-born” and “foreign-born” workers. In September, the latter rose by 14,000 to 24,928.
That was the good news. The bad news: native-born workers saw their ranks tumble by 262,000!

More disturbing, as the following chart shows, after briefly topping their December 2007 level, native-born jobs (blue line below) are now in danger of once again going back into the red. In the meantime, foreign-born workers are steadily increasing (and helping populate all those “part-time” jobs)
Finally, this is what the native-vs-foreign born discrepancy looks like since December 2007: in the past 8 years, there has been 300% more foreign-born workers added than native-born.
Prepare to hear much more about this statistics in the coming GOP presidential debates.
• source: zerohedge.com
The American ‘Recovery’ In 1 Chart


I believe the age-old notion of “working to make a living,” or in reality, working to make a few at the top even more insanely and despotically wealthy and powerful, has finally run its course with a large portion of people.
It’s time for a change, a DRASTIC one!
Reblogged this on An Outsider's Sojourn II.
thanks for passing it along. More to come from John Titus- he’s good- all sourced info
[…] Fed is driving the U.S. into a 2nd depression in order to carry out its one and only remit now that America’s ability to produce real jobs has been reduced to ash, namely, propping up criminal banks with multi-trillion-dollar […]
[…] Fed is driving the U.S. into a 2nd depression in order to carry out its one and only remit now that America’s ability to produce real jobs has been reduced to ash, namely, propping up criminal banks with multi-trillion-dollar […]